These five reports follow readers from hitting a content gate through to paying, cancelling and the revenue that results. The first two are available to everyone; the last three appear only if your publication has at least one active product. For the shared controls, see Accessing the Analytics tab.
The screenshots in this guide come from the Lede FYI demo publication, so every figure in them is sample data.
Conversion Events
Up to four counts over time, the raw material of your registration and paywall funnel. Publications without an active product see the first three only.
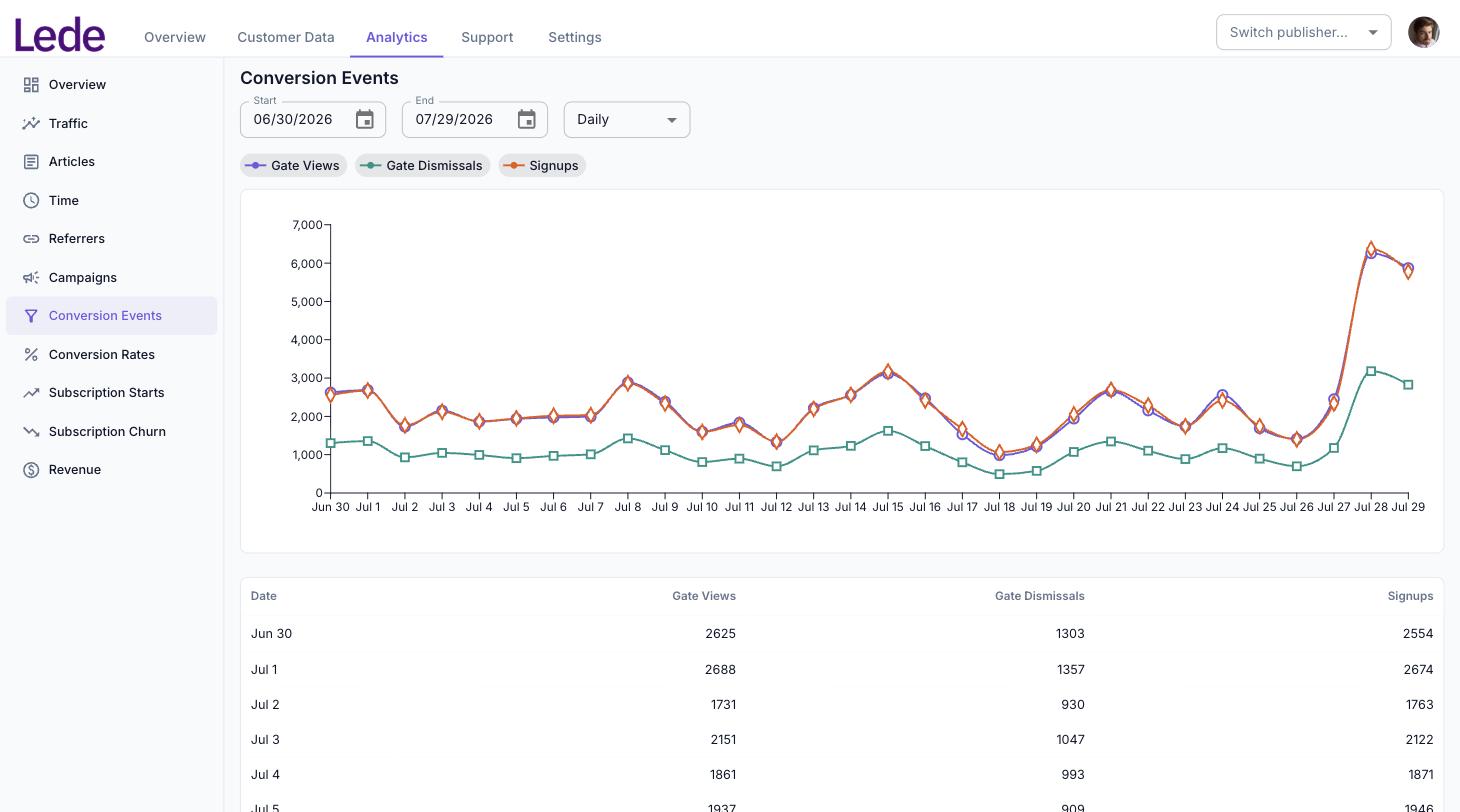
- Gate Views — a registration wall or paywall was shown to a reader
- Gate Dismissals — a reader closed one without acting on it
- Email Signups — a new account was created
- Subscriptions — a paid subscription was purchased (shown when your publication has commerce enabled)
These are event counts, not people. One reader who hits gates on four articles in an evening contributes four gate views. Gate views and dismissals are also counted once per time the gate is displayed, so a reader who scrolls back up to an article they already opened does not add a second one.
The gap between Gate Views and Gate Dismissals is the more useful shape here. A dismissal rate that climbs after you change your gate settings is a fast signal that the new configuration is landing badly.
Conversion Rates
Two series — Content Gate → Email Signup and Content Gate → Subscription — each expressing that outcome as a percentage of gate views in the same period. Publications without commerce see only the first.
This is a ratio, not attribution. It divides the sign-ups in a bucket by the gate views in that same bucket. It does not check whether the people who signed up were the same people who saw a gate, and it does not allow for someone seeing a gate on Monday and subscribing on Thursday. A reader who signs up from a newsletter link without ever seeing a gate still counts in the numerator.
The practical consequence is that the figure can exceed 100% when sign-ups are running ahead of gate impressions, and that a day with very few gate views will produce a wild-looking percentage. Read it as a trend line over a reasonable window rather than as a literal conversion rate, and switch to Weekly or Monthly if the daily line is too noisy to interpret.
If you need attribution — which article led to which signup or subscription — see the Email Signups and Subscriptions columns in the Articles report, which credit each conversion to the last article read in the same visit.
Subscription Starts
New subscriptions over time, split three ways.
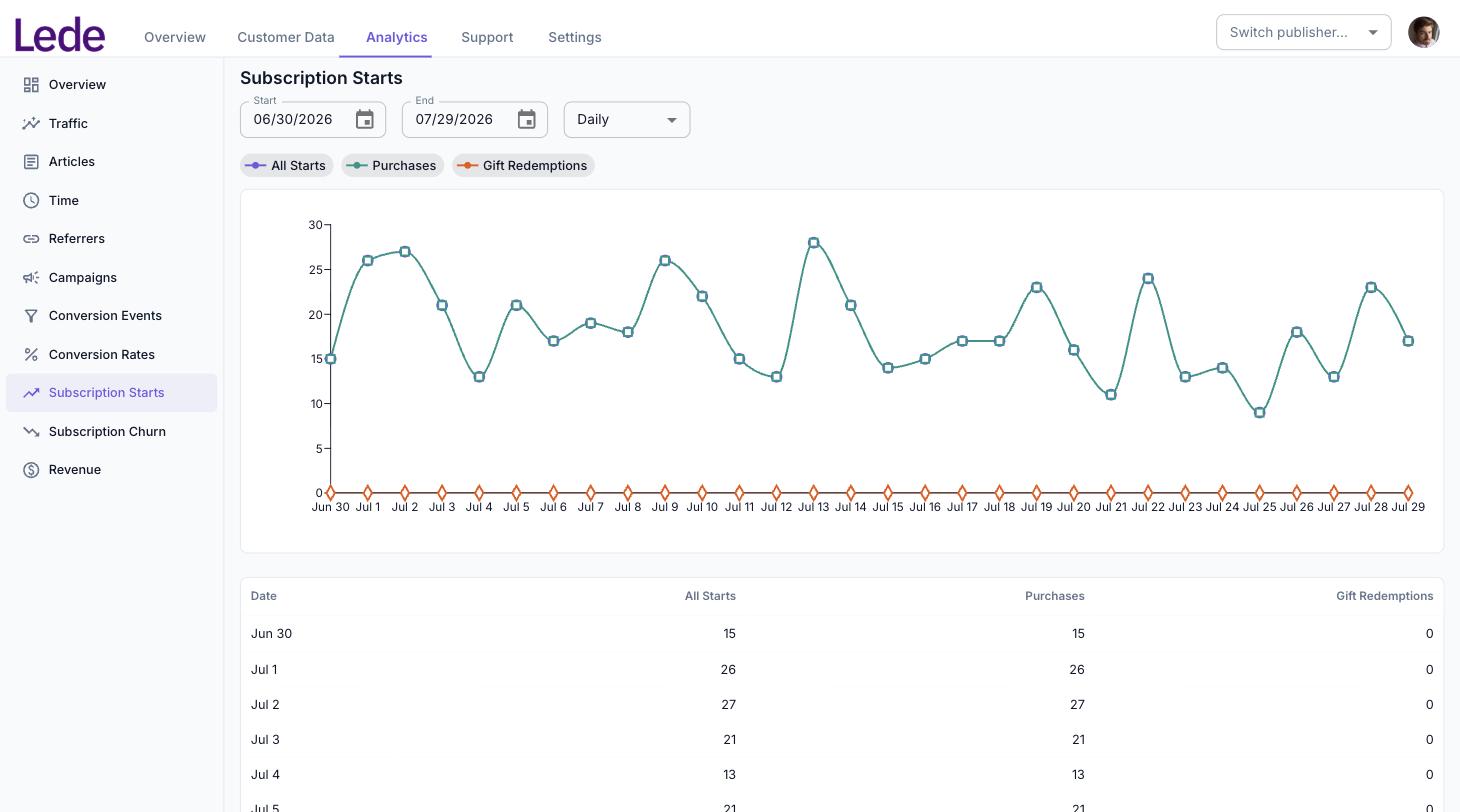
- Purchases — someone bought a subscription
- Gift Redemptions — someone redeemed a gift subscription
- All Starts — the two added together
This report reads the merged, de-duplicated record of each checkout, so a purchase is counted once whether it was reported by the reader’s browser or by our payment system. That is also why these figures can be higher than the purchase numbers a browser-only analytics tool shows you — roughly one in seven checkouts is never reported by the browser at all.
These are starts, not net growth. Renewals are not counted here, and neither are cancellations — pair this with Subscription Churn to see the whole picture.
Subscription Churn
Cancellations over time. All Products is the total; individual series are added for your most-cancelled products, up to twelve of them.
Churn counts the moment a reader chooses to cancel, not the moment their access ends. Someone who cancels an annual subscription in January but keeps reading until December appears on the January line. This report tells you when people decided to leave, which is what you want for spotting a bad week — but it is not a measure of subscribers lost in the period, and it will not reconcile against a billing report.
A subscription that lapses because a card failed, rather than because the reader cancelled, does not appear here. Neither does a cancellation that was later undone, which will still show as a cancellation on the day it happened.
If the report is empty, that is good news rather than a fault — it means no cancellations were recorded in the range.
Revenue
Recognised revenue over time.
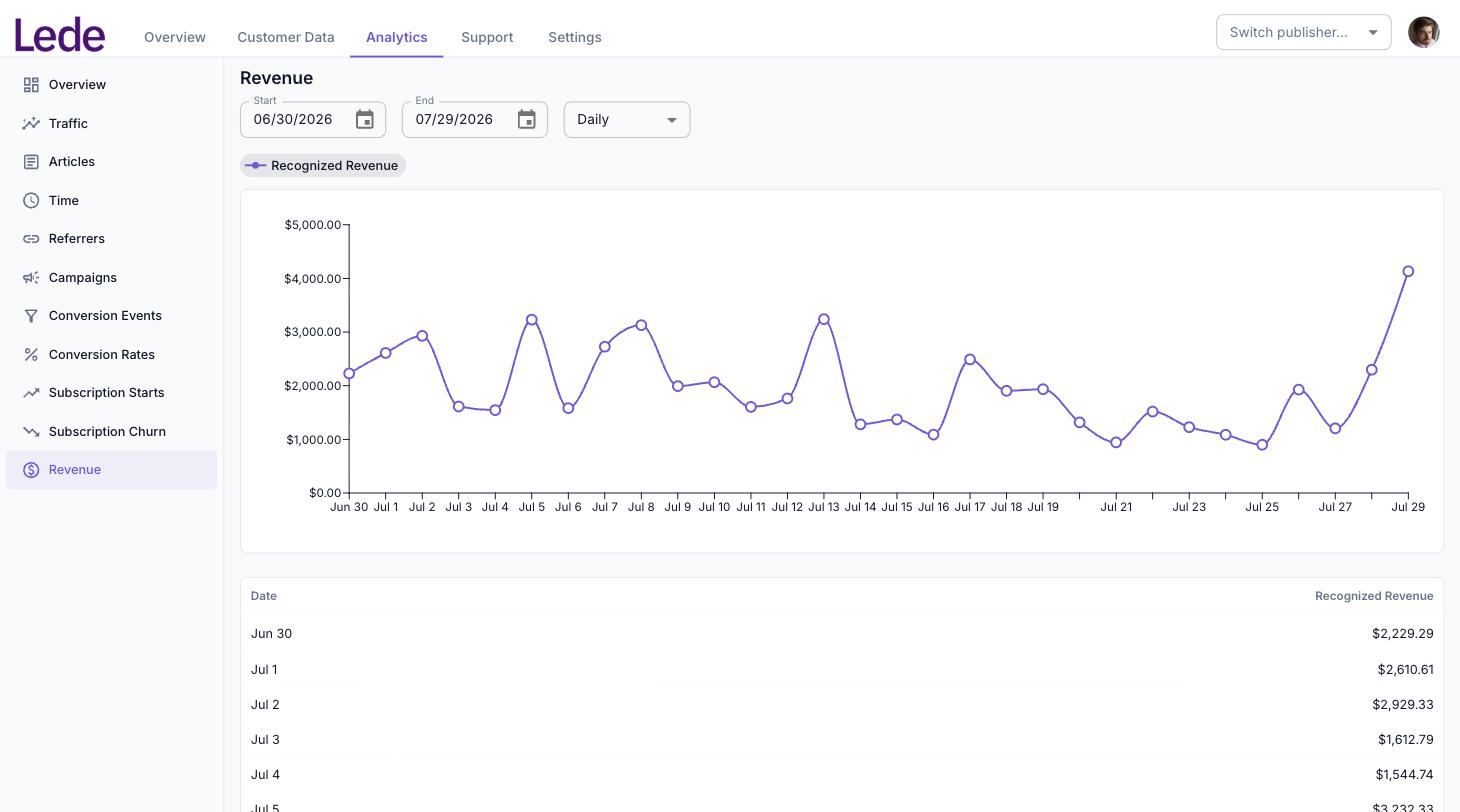
Recognised revenue spreads income across the period it covers rather than booking it all when the card is charged:
- An annual subscription is spread evenly across the twelve months it covers, so a single annual payment contributes one twelfth to each of twelve monthly buckets.
- A monthly subscription, and any purchase made on a sale, is recognised in full on the day it was charged.
This is why a large annual sign-up does not produce a spike on the chart, and why revenue appears in months where nothing was actually charged. It gives you a smoother picture of the business than cash receipts do.
Two things to keep in mind. Refunds are not deducted — a refunded payment stays in the figures at its full value. And the report assumes a single currency and labels everything with a dollar sign, so if you sell in more than one currency the totals are not meaningful. For refund-adjusted or multi-currency figures, use your payment provider’s own reporting.
Renewals are included here, unlike in Subscription Starts. Revenue answers “what is the business worth this month”; Subscription Starts answers “how many new people joined”. They will not line up, and they are not supposed to.