These six reports cover how many people came, what they read, how long they stayed and where they came from. They are available to every publication. For the controls shared by all of them, see Accessing the Analytics tab.
The screenshots in this guide come from the Lede FYI demo publication, so every figure in them is sample data.
Overview
The Overview is a fixed seven-day summary. It has no date controls — it always covers the last seven days.
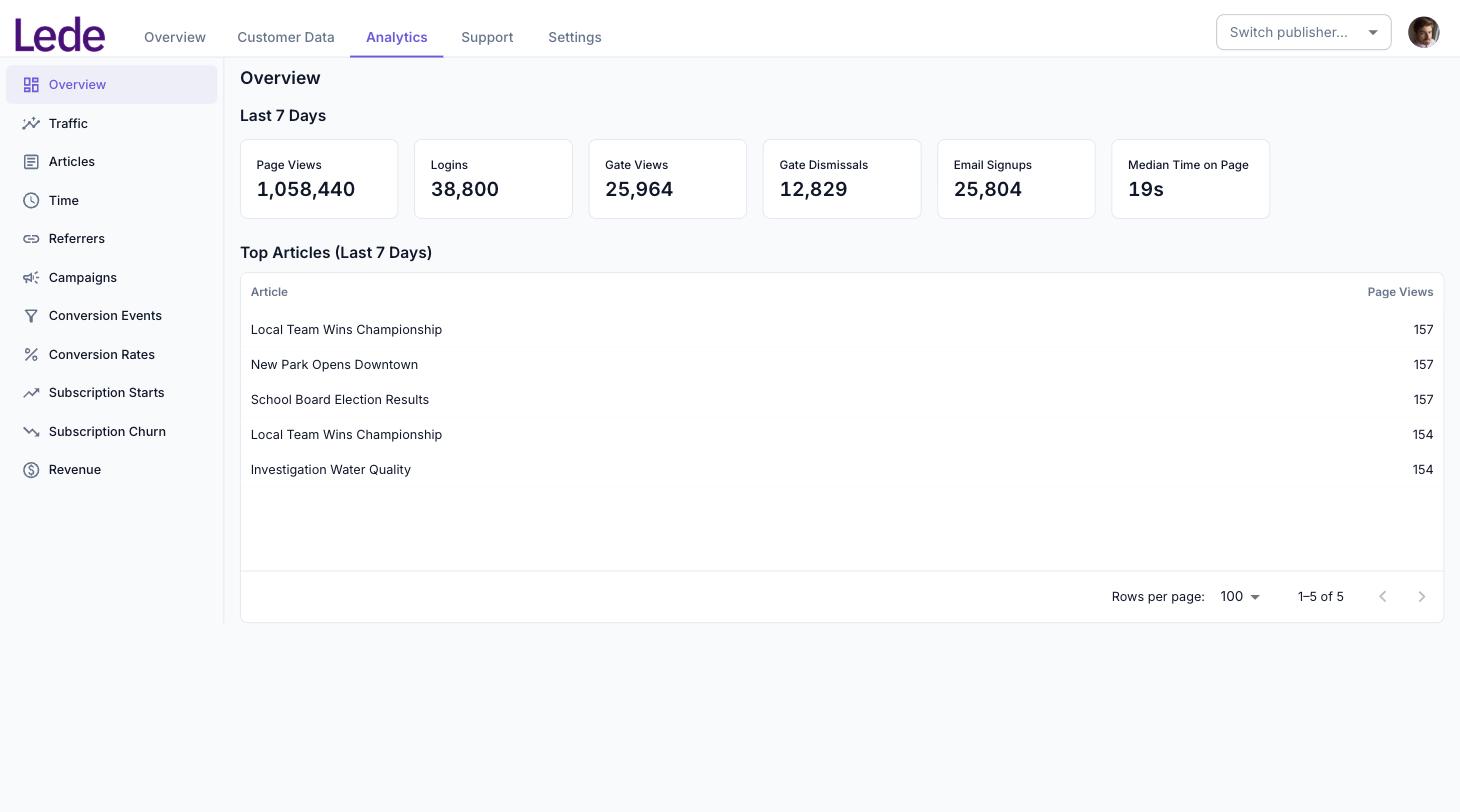
The cards are simple event counts for the period:
- Page Views — pages opened
- Logins — readers signing in
- Gate Views — times a registration wall or paywall was shown
- Gate Dismissals — times a reader closed one
- Email Signups — new accounts created
- New Subscriptions — paid subscriptions started (shown only when your publication has an active product)
- Median Time on Page — the midpoint of how long readers spent on a page
Top Articles lists your five most-read articles over the same seven days, by page views. The title shown is the most recent one Beacon saw, so if you have re-headlined a piece you will see the new headline against all of its history. Signups and Subscriptions columns show how many email signups and paid subscriptions each article led to — see the Articles report for how those are attributed.
Median Time on Page shows a dash when there is no measured timing data. See the Time report below for why some page views are not measured.
Traffic
Three series over the period you choose: Page Views, Sessions and Unique Users.
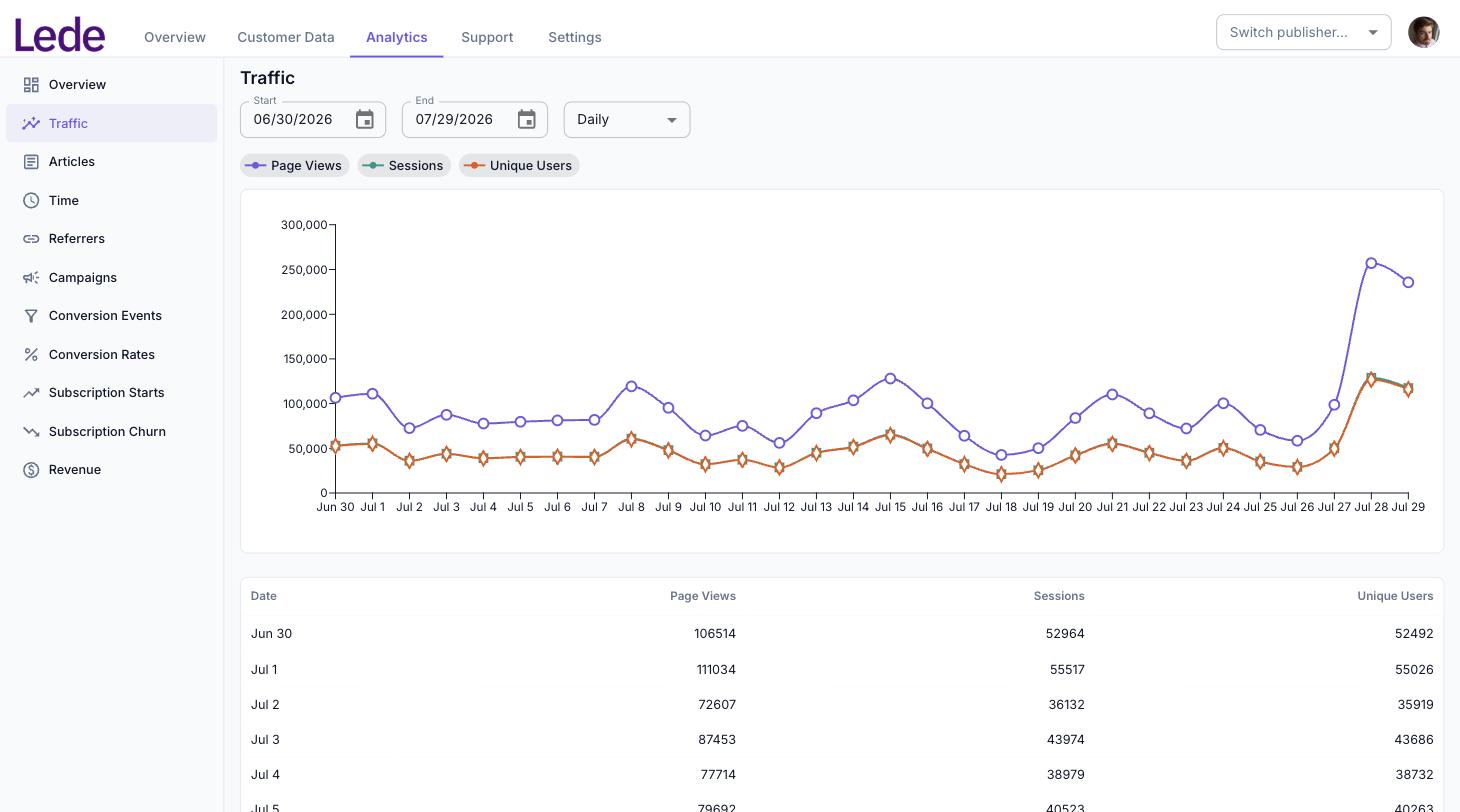
- Page Views counts pages opened. Moving between articles without a full page reload still counts as a page view, so this is closer to “articles read” than to “times the site loaded”.
- Sessions counts visits, where a visit ends after 30 minutes of inactivity.
- Unique Users counts distinct anonymous browsers.
Sessions and Unique Users are approximate and cannot be added up across rows. If you want a monthly unique figure, set the date range to that month rather than summing the daily column. What is Beacon? explains why.
The ratio of page views to sessions is a decent loyalty signal: it tells you how many pages a typical visit covers. The ratio of sessions to unique users tells you how often people come back within the period.
Articles
Page views per article for the period, charted as a ranked bar chart of the top 15 and listed in full below it. Two further columns, Email Signups and Subscriptions, tie conversions back to your content: each conversion is credited to the last article the reader viewed in the same visit.
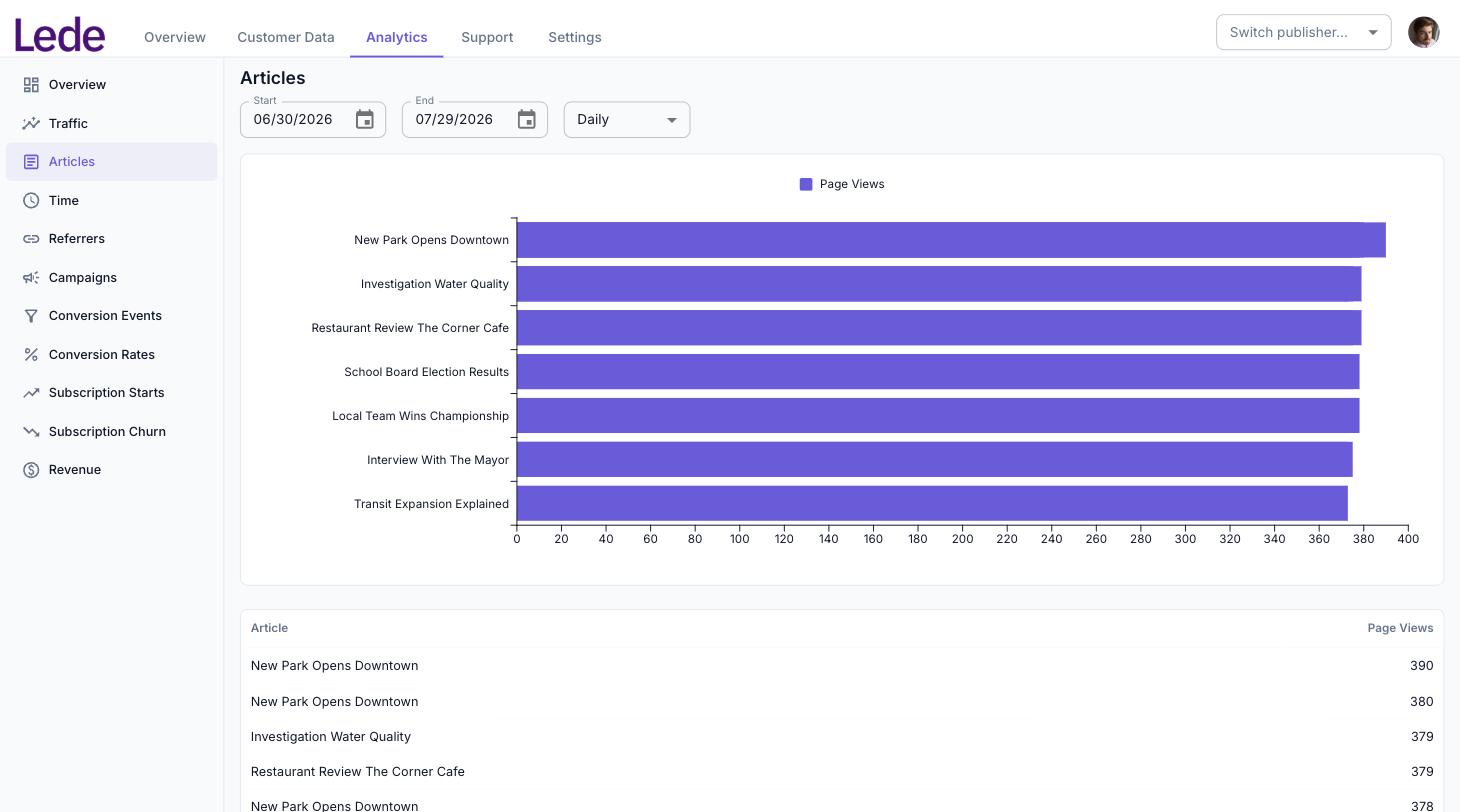
Articles are grouped by their internal ID, not by their headline, so you may see the same or a similar headline more than once in the table — those are genuinely different posts. Only pages Beacon could identify as a piece of content appear here; section fronts, the homepage and account pages are excluded.
Attribution is per visit, so the acquisition columns will not add up to the totals in the Conversion Events report — a reader who goes straight from an advert to your products page and subscribes never viewed an article, and that subscription is credited to no article at all. Read the columns as “conversions this article drove directly”.
Time
How long readers actually spend on each article. This is the report to reach for when page views alone are not telling you which pieces landed.
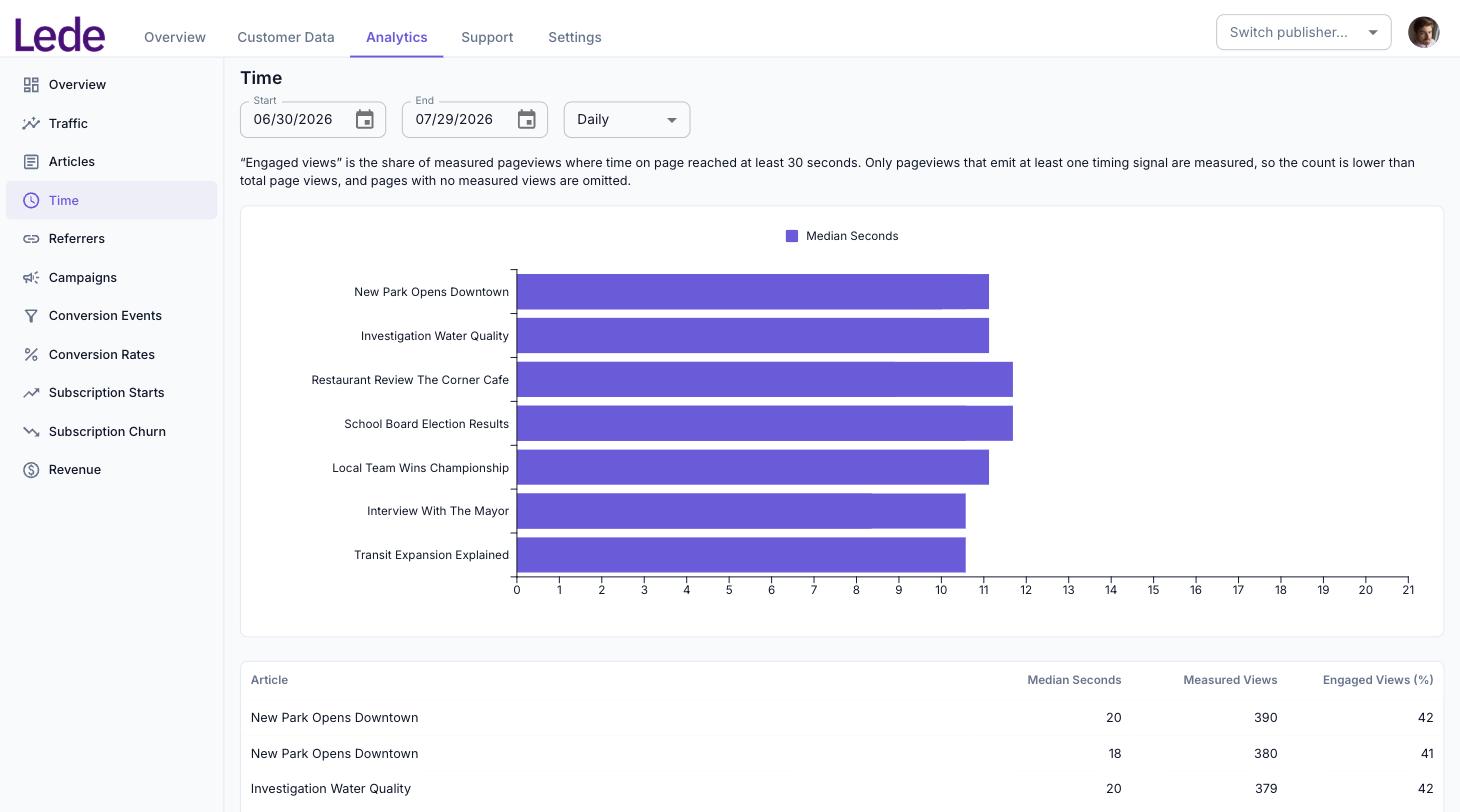
- Median Seconds — the midpoint of time on page. Half of measured views were shorter, half longer.
- Measured Views — how many page views produced usable timing data.
- Engaged Views (%) — the share of measured views that reached at least 30 seconds.
Measured Views is always lower than Page Views. Timing depends on the reader’s browser sending a signal back while the page is open, and plenty of visits never do — a reader who opens a page and immediately leaves usually produces no timing at all. Articles with no measured views are left out of this report entirely. Read the percentages as “of the readers we could measure”, not “of everyone”.
The report uses the median rather than an average on purpose. A single tab left open overnight would drag an average into the hours; the median ignores it. Typical values sit in the 20 to 60 second range, so do not be alarmed by a number that looks low — compare articles against each other rather than against an absolute target.
Referrers
Where your page views came from, based on the referring address the browser reported.
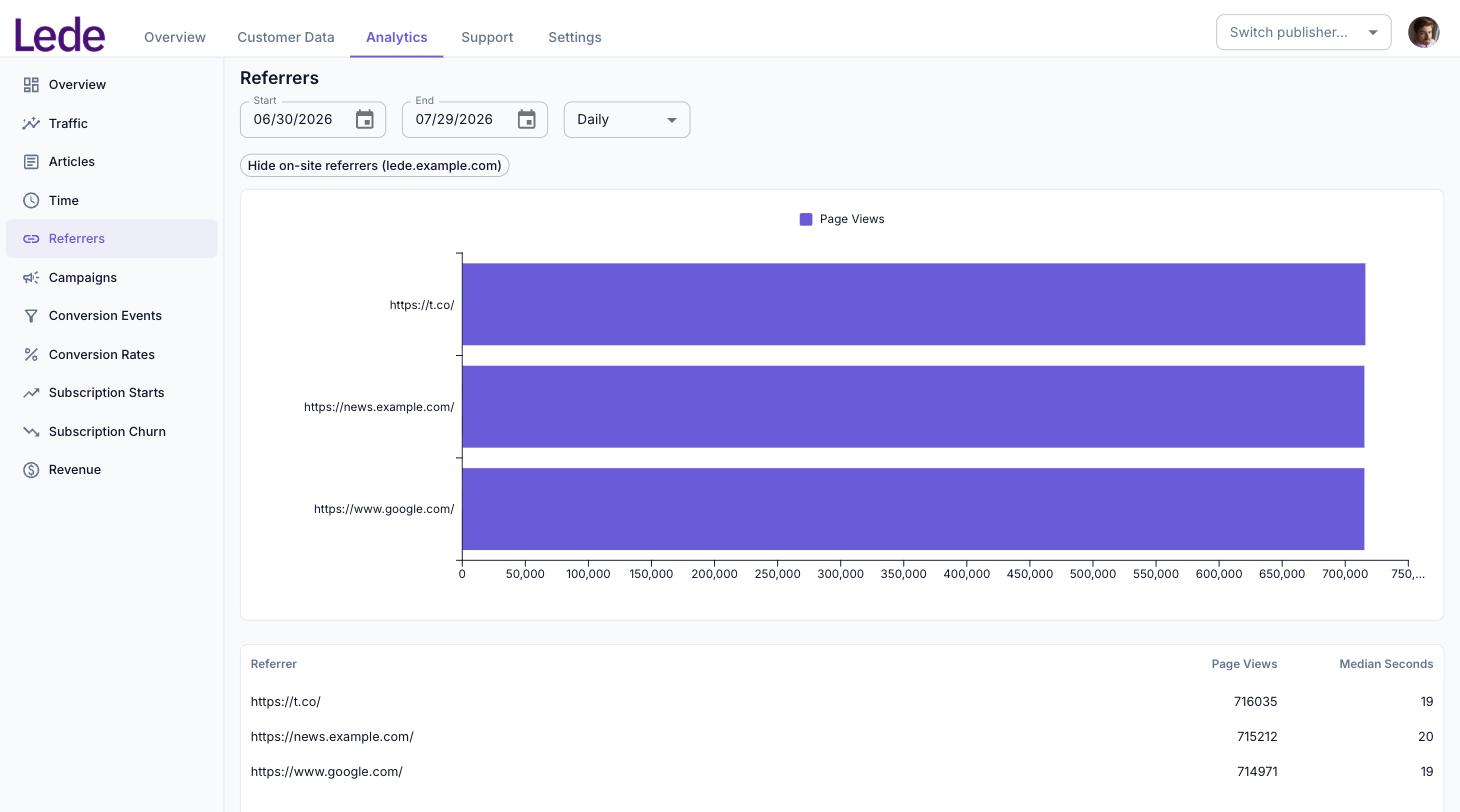
The Hide on-site referrers chip filters out readers arriving from your own site — someone clicking from one article to the next. Turn it on when you want external traffic sources only; leave it off to see internal navigation as well.
The Median Seconds column shows how long readers from each source stayed, which is often more revealing than the volume alone: a source sending fewer but far more engaged readers is worth knowing about.
Referrers are listed as raw addresses, not grouped into channels. There is no “Social” or “Search” roll-up, so Google, Google News and a Google image search appear as separate rows, and a link shortener shows as the shortener rather than the platform behind it. Direct traffic, and any browser that withholds the referrer, is simply absent rather than listed as “direct”.
Campaigns
Page views broken down by the utm_campaign tag on the address a reader arrived at.
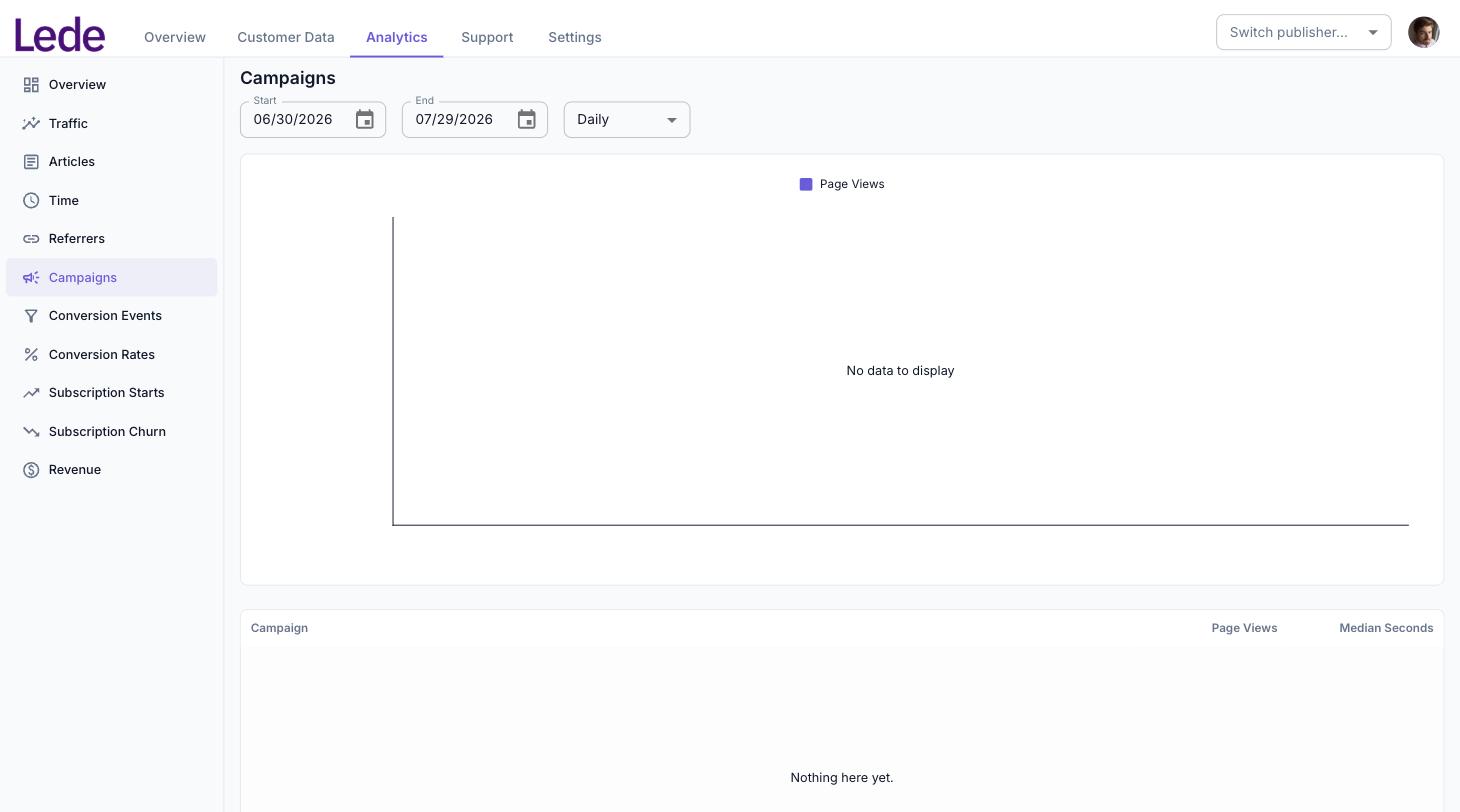
If you tag your newsletter links, social posts or paid placements with UTM parameters, each campaign appears here with its page views and median time on page, ranked highest first. If you do not tag anything, the report is empty — as above.
A campaign is credited only to the specific page view whose address carried the tag. It does not follow the reader through the rest of their visit, so a campaign that brings someone in who then reads five more articles is credited with one page view, not six. Treat this as “how many entries did this campaign drive”, not as full campaign attribution.